


Constraints on the Timing of the Saginaw Impact Manifold
If our conjecture were true, all the bulk of the material making up the bay would have been delivered during a one hour period ~786,000 years ago. The new technology for dating using 10Be/26Al nuclides may help place the ages for the burial of strata found immediately below Carolina bay rims.
Until recently, the geochronology techniques available to place constraints on the timing of recent events have included carbon dating, thermo-stimulated luminescence (TSL), optically stimulated luminescence (OSL), thermally transferred OSL (TT-OSL), and temporal controls from the ages of surfaces covered by Carolina bays. Identification of a wide date range for elements of the bays’ underlying basin structure would falsify any impact hypothesis, and other workers have reported such results (Ivester, A.H, et al, 2007) using OSL techniques. We suggest all Carbon dating and OSL dating to date only identify minimal ages for the bays, as the reported dates are all less than our assumed creation event date. Given the composition of a Carolina bay rim as unconsolidated surface deposits of sand, it should be expected that wind and wave re-workings of the landform would have been an ongoing process since their creation.
Our proposal that the bays are composed of distal ejecta presents a challenge to such dating exercises. Our position on OSL dating is that it does support our hypothesis if properly applied. In numerous bay examples, we suggest the energetic formation of the burst-bubble rim was accomplished with little or no “bottom”, allowing core samples to progress through the deposition horizon and into the hosting strata with no discernible transition. This allows for a continuum of dating back 200 ka or more. OSL technology, with its dependence on exposure to sunlight for multiple hours, has applicability to gradualistic sedimentary processes and may hold no relevance within the context of a mass deposition of ejecta, while TSL may hold more promise given a superheated ejecta regimen. Obviously, the environs around and within the basins were subject to reworking and the infilling of newer sediment over the intervening millennia. Attempts at applying dating techniques must discriminate between the two depositional sequences, and we propose that constraints imposed by dating depositional surfaces immediately below and above the bay stratum may be more appropriate. Our LiDAR images show numerous situations where true wind-driven dune systems are overriding bay structures, at angles totally unrelated to the bays’ orientations; see Bay Planforms.
The following quote is from a 1988 paper entitled Geology and Tectonic History of the Lower Cape Fear River Valley, Southeastern North Carolina; Surface And Shallow Subsurface Geologic Studies Of The Carolina Coastal Plains, U.S. Geological Survey Professional Paper 1466-A, By David R. Soller.
Dunes and Carolina bays cover much of the outer Coastal Plain in the Carolinas and are particularly striking in the Cape Fear River valley. Carolina bays in particular have been studied in detail; past research has dealt largely with morphology and mode of origin (Johnson, 1942; Buell, 1946a, 1946b; Frey, 1951, 1953, 1955; Prouty, 1952; Kaczorowski, 1977). Thom (1970) inferred the age of formation for Carolina bays in the Pee Dee River valley on the basis of radiocarbon data; his estimate is here considered to be a minimum age because the age as concluded in this report far exceeds the limits of radiocarbon dating. Data gathered for this study provide a unique opportunity to indirectly date the formation of the Carolina bays and dunes.
If it is assumed that all Carolina bays were formed by a single, unique climatic event, then this event must have occurred after deposition of the Socastee Formation and before deposition of the Wando Forma tion, as Carolina bays are prominent on the Socastee terrace but absent from the Wando. Since these terraces are correlated with isotopically age-dated formations, the date of Carolina bay formation falls somewhere between roughly 100 and 200 ka, roughly equivalent to the Illinoian glaciation.
If there are indeed two or more generations of Carolina bays, the age of formation suggested above would necessarily be true only for those bays on the Socastee terrace; bays on older terraces could be much older. Absence of Carolina bays from the Wando terrace, and the derivation of only minimum radio carbon dates from peat beneath bay rims is strong evidence that supports a pre-Wando age for formation of all Carolina bays.
Carolina bays have been shown to be wind-derived features (Kaczorowski, 1977) and therefore likely to have formed at the same time as the dunes. Mineralogic and radiocarbon data indicate at least two periods of dune formation. The most recent episode was Holocene; migrating dunes were dated at 7,700 and 5,720 yBP in the lower valley. These dunes have immature sand mineral assemblages and are present only next to the river. There are no Carolina bays associated with these dunes; conditions apparently were not favorable for the formation of these features. These dunes were a short lived phenomenon, as sand was available from the incised Cape Fear River flood plain only until approximately 3,540 yBP, when backfilling of the channel began. Farther from the river, and associated with Carolina bays, are dunes with mature sand mineral assemblages that are dated at greater than 35,000 yBP. Assuming these dunes to be the same age as the Carolina bays, they were formed approximately 100 to 200 ka. Whether these older dune sands are of two or more ages could not be resolved in this cursory examination of dunes and Carolina bays; a more detailed geomorphic and mineralogic study would be required.
The Cape Fear Arch in NC has been rising by as much as 0.6mm a year for 2.5 million years. One side effect is that the Cape Fear River has been migrating laterally to the south and west as its bed is tilted. At each glacial maxima over the intervening 2.5 million years, there has been a deep incision as the sea level drops. Then, when it returns during the interglacials a terrace is formed at a new, lower elevation. All the terraces except the most recent - called the Wando - have bays on the surface. There are no indications that braided fluvial deposits ever existed on those older surfaces. They were reworked by some mechanism which masked the braiding.Importantly, the Wando is known to have been created during the Sangamon interglacial, 130 to 70ky ago. No bays exist on the Wando or the subsequent Holocene interglacial. No bays during the LGM, with all those powerful winds! Just a ragged, braided surface looking significantly different from the higher terraces to the north and east. We interpret this to be proof positive that the bays are not created by a generic wind and wave process across all sandy surfaces in the area. At the same time, it mandates that they were created prior to 130Ka - before the "Penultimate" Illinoian Glaciation. Additionally, the next terrace above the Wando - called the Socastee - is dated as being created during the previous interglacial. Since this is fully covered with bays, right up to the incision that dropped down to the Wando, it provides an upper constraint on formation of ~200ka during the interglacial prior the Illinoian maximum. It is our hypothesis that the date of the Socastee is far older, and will endeavor to uses the 10Be dating technology to prove or falsify our hypothesis. As motivation for our interpretation, here is the graph used by Soller in his paper to elucidate the river incision rates. The huge increase in rates to justify the river’s course seems extreme:
With regard to the gradualistic creation proposal of Kaczorowski and others, the failure of the mechanism to create actual Carolina bay landforms on the sandy, basin-riddled Wando Surface present a significant problem. To suggest that 50,000 land forms were created during times of high winds from the Glacial Sheets, and then suggest that the process simply was not active during the Last Glacial Maximum is hard to rationalize.
We have created a Google Earth KMZ visualization of the terraces and the related Carolina bay locales. Use the KMZ Link to load this.
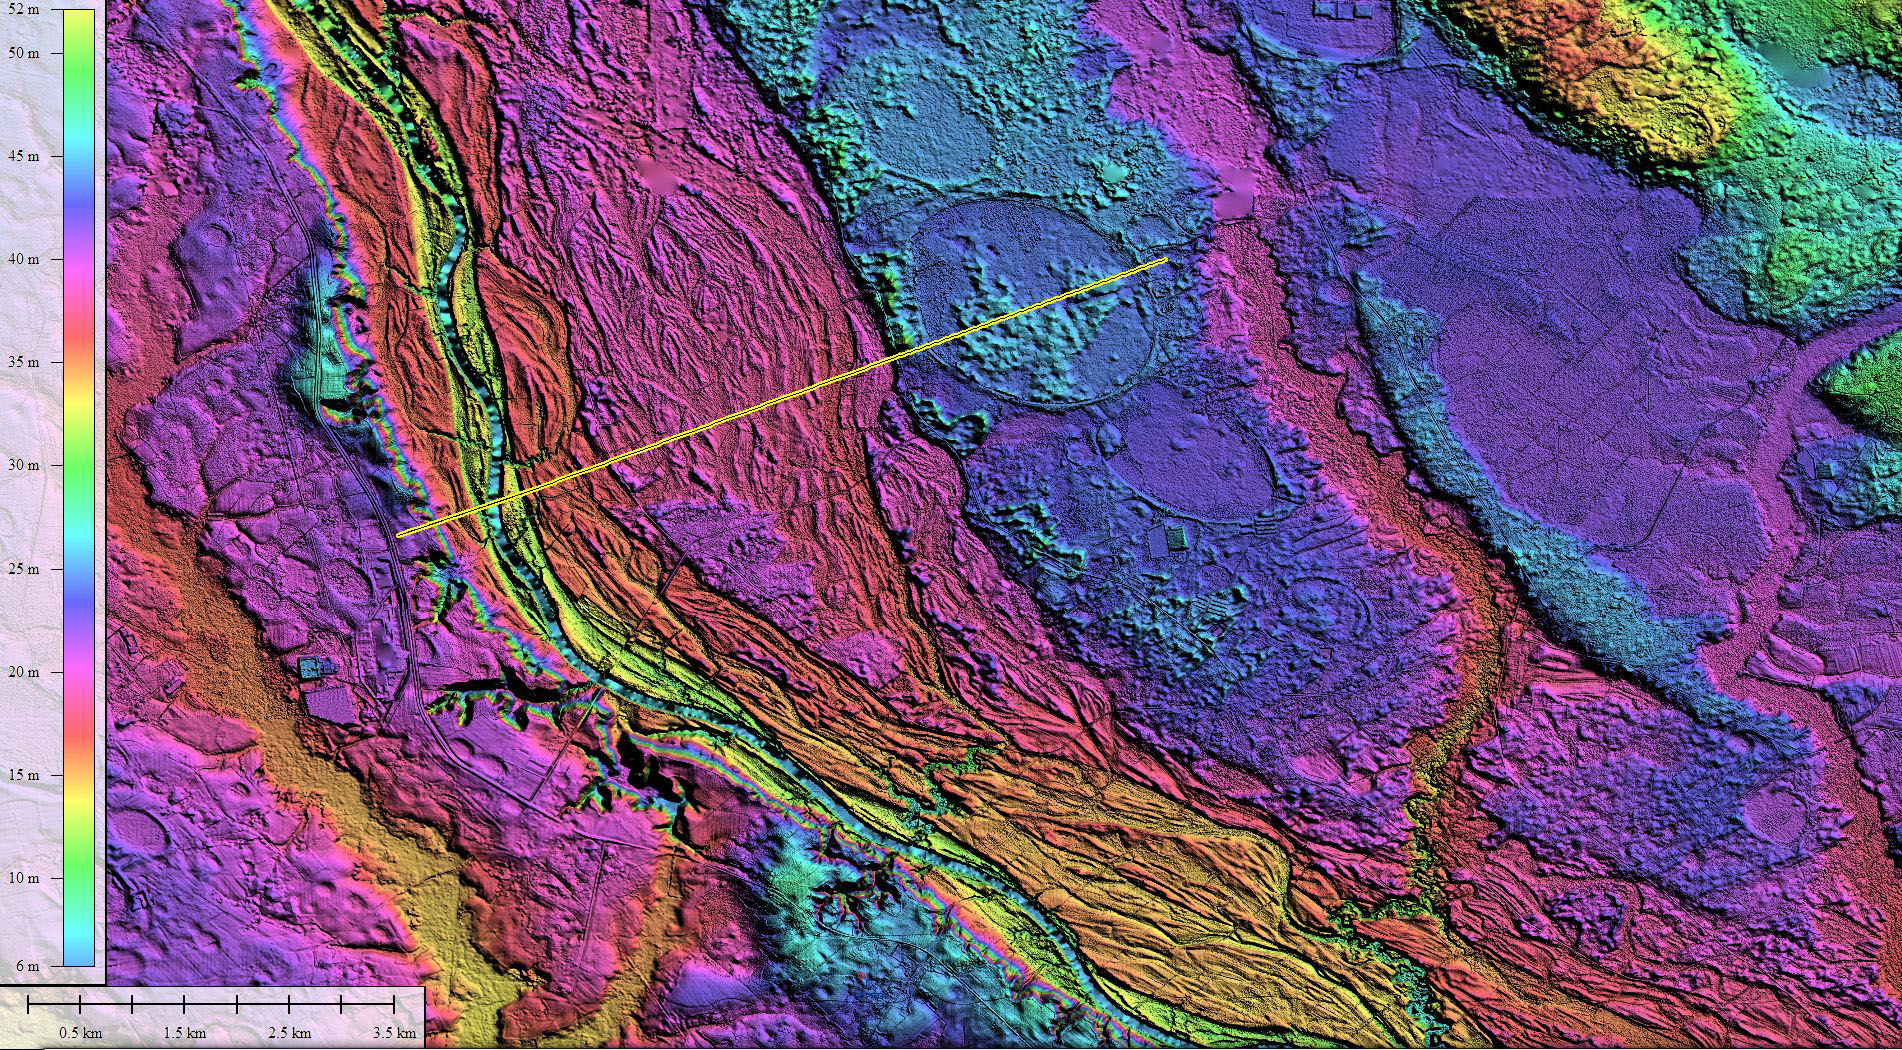
Wando Terrace and Holocene Flood Plain and adjacent terraces (linked to higher resolution version)
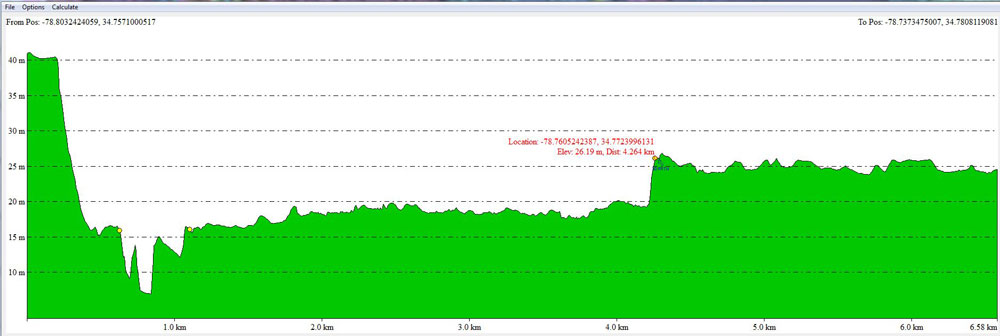
Elevation Profile of Wando Terrace
We call attention to geological anomalies that may correlate with the Carolina bays and which offer support for dating the event ca 40 ka:
Collateral Damage
Ejecta deposition on the scale proposed would have created collateral damage to the North American environment. Burials of fauna, flora and paleosols would be evident beneath the blanket. One example of this may be the ancient Baldcypress trees buried within a 10-meter deposit of white sand near Pee Dee, SC, which are dated at ca 40 ka. (Stahle, D.H., 2005, available on line at http://www.uark.edu/misc/dendro/subfossil.pdf). Stahle, et al, make an interesting observation:
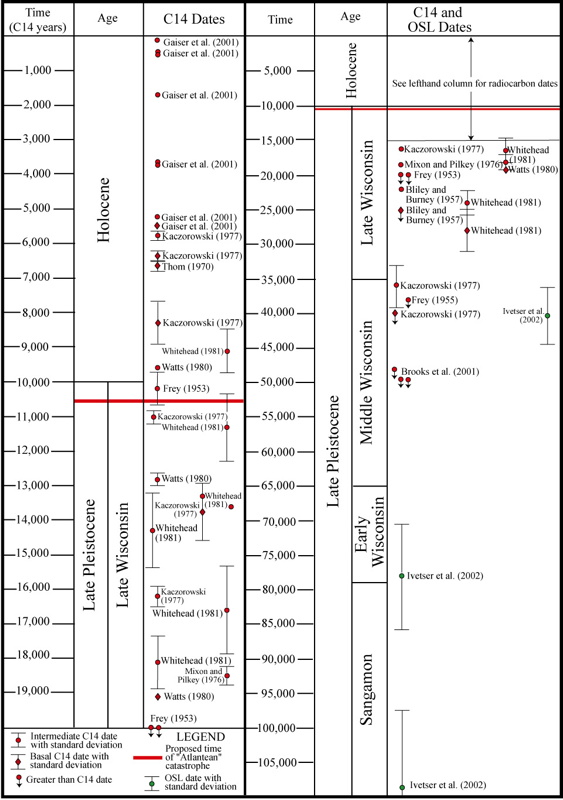
Radiocarbon Dates
The finite radiocarbon dates range in age from 440 ± 50 to 27,700 ±2,600 BP radiocarbon in age Whitehead 1981, Gaiser et al. 2001. Some samples are so old, they contained insufficient radiocarbon for dating, which results in "greater than" dates. For example, samples from sediments filling Carolina bays have been dated at greater than 38,000 to 49,550 BP radiocarbon years Frey 1955, Brooks et al. 2001. Ivester has identified two individual samples of sand which fall well outside this range of under 50,000 years.
Nebraska Antecedent Basins
An examination of oriented Nebraska basins (Kuzila, M.S., 1994) has shown that late Wisconsinian loess deposits dated at ca 27 ka are draped evenly over hundreds of antecedent basin structures, smoothing the basins’ sharp rim relief, however not affecting their oval planform. Onset of similar loess deposition over an antecedent basin at Bignell Table, NE has been dated at ca 40 ka. These results suggest the structural basins were deposited prior to 40 ka.